The stats engine.
Every number, defined.
Rallymetrica computes every statistic from the points you record, under the rules of the match. Nothing is estimated from video or sensors: a number exists only when the point data behind it was tapped. This page lists what the engine measures, how each metric is defined, which tracking level it needs, and how the Stats tab turns a run of matches into a trend.
What each tracking level unlocks
The tracking level is chosen at match setup and can be changed during the match; the new level applies to that match. Each level includes everything below it.
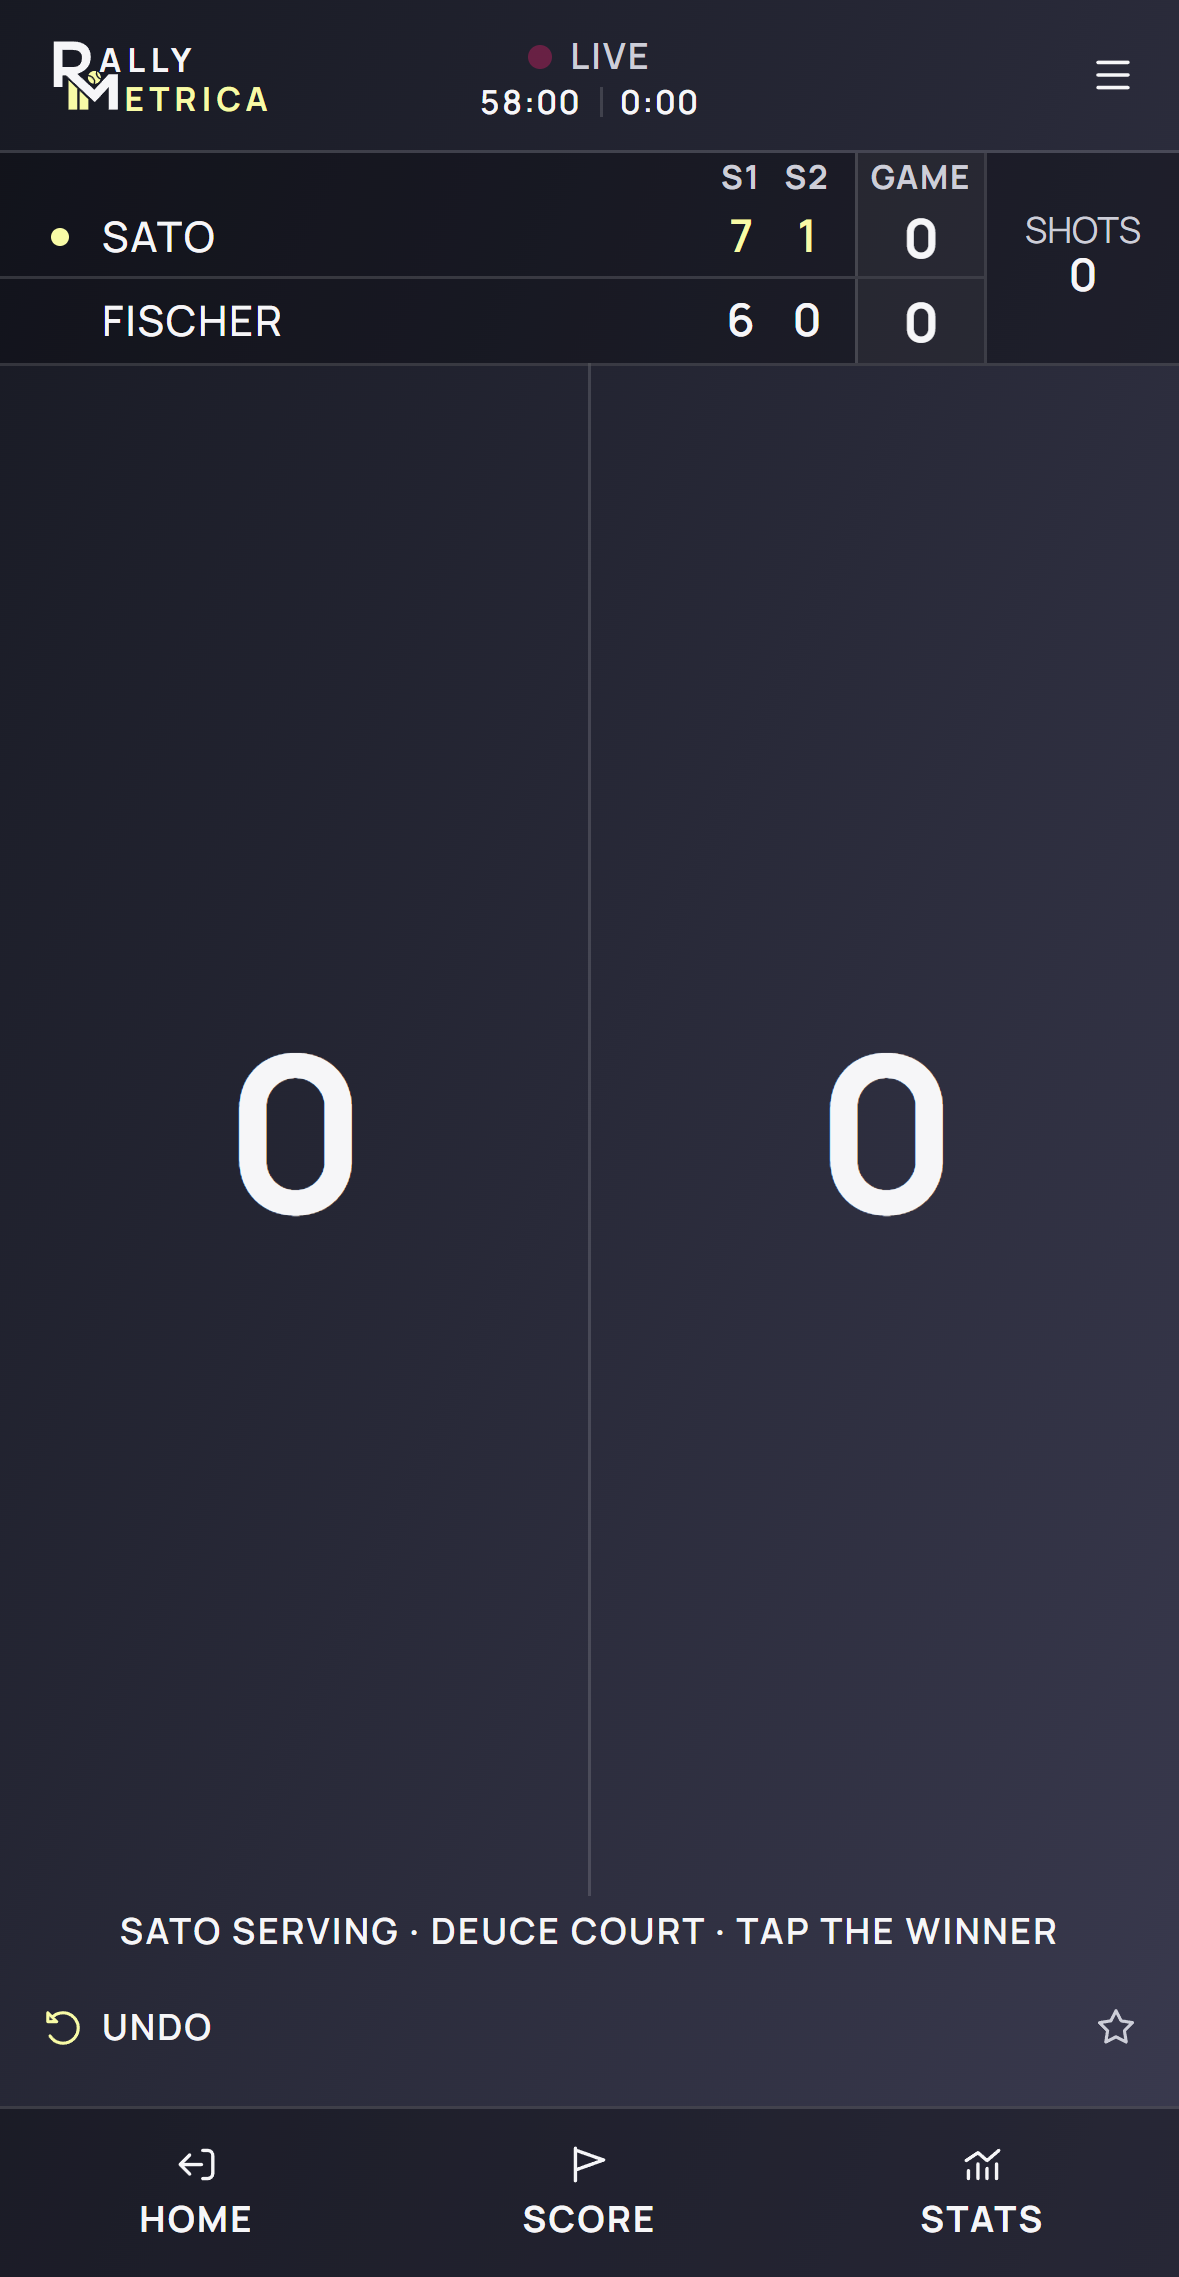
Score
You tap the side that won the point. The engine keeps the score, the games and sets under the match’s rules, every break point and pressure situation, and the momentum curve.
Unlocks · Points won · break points · the whole Pressure page · Momentum · Timeline
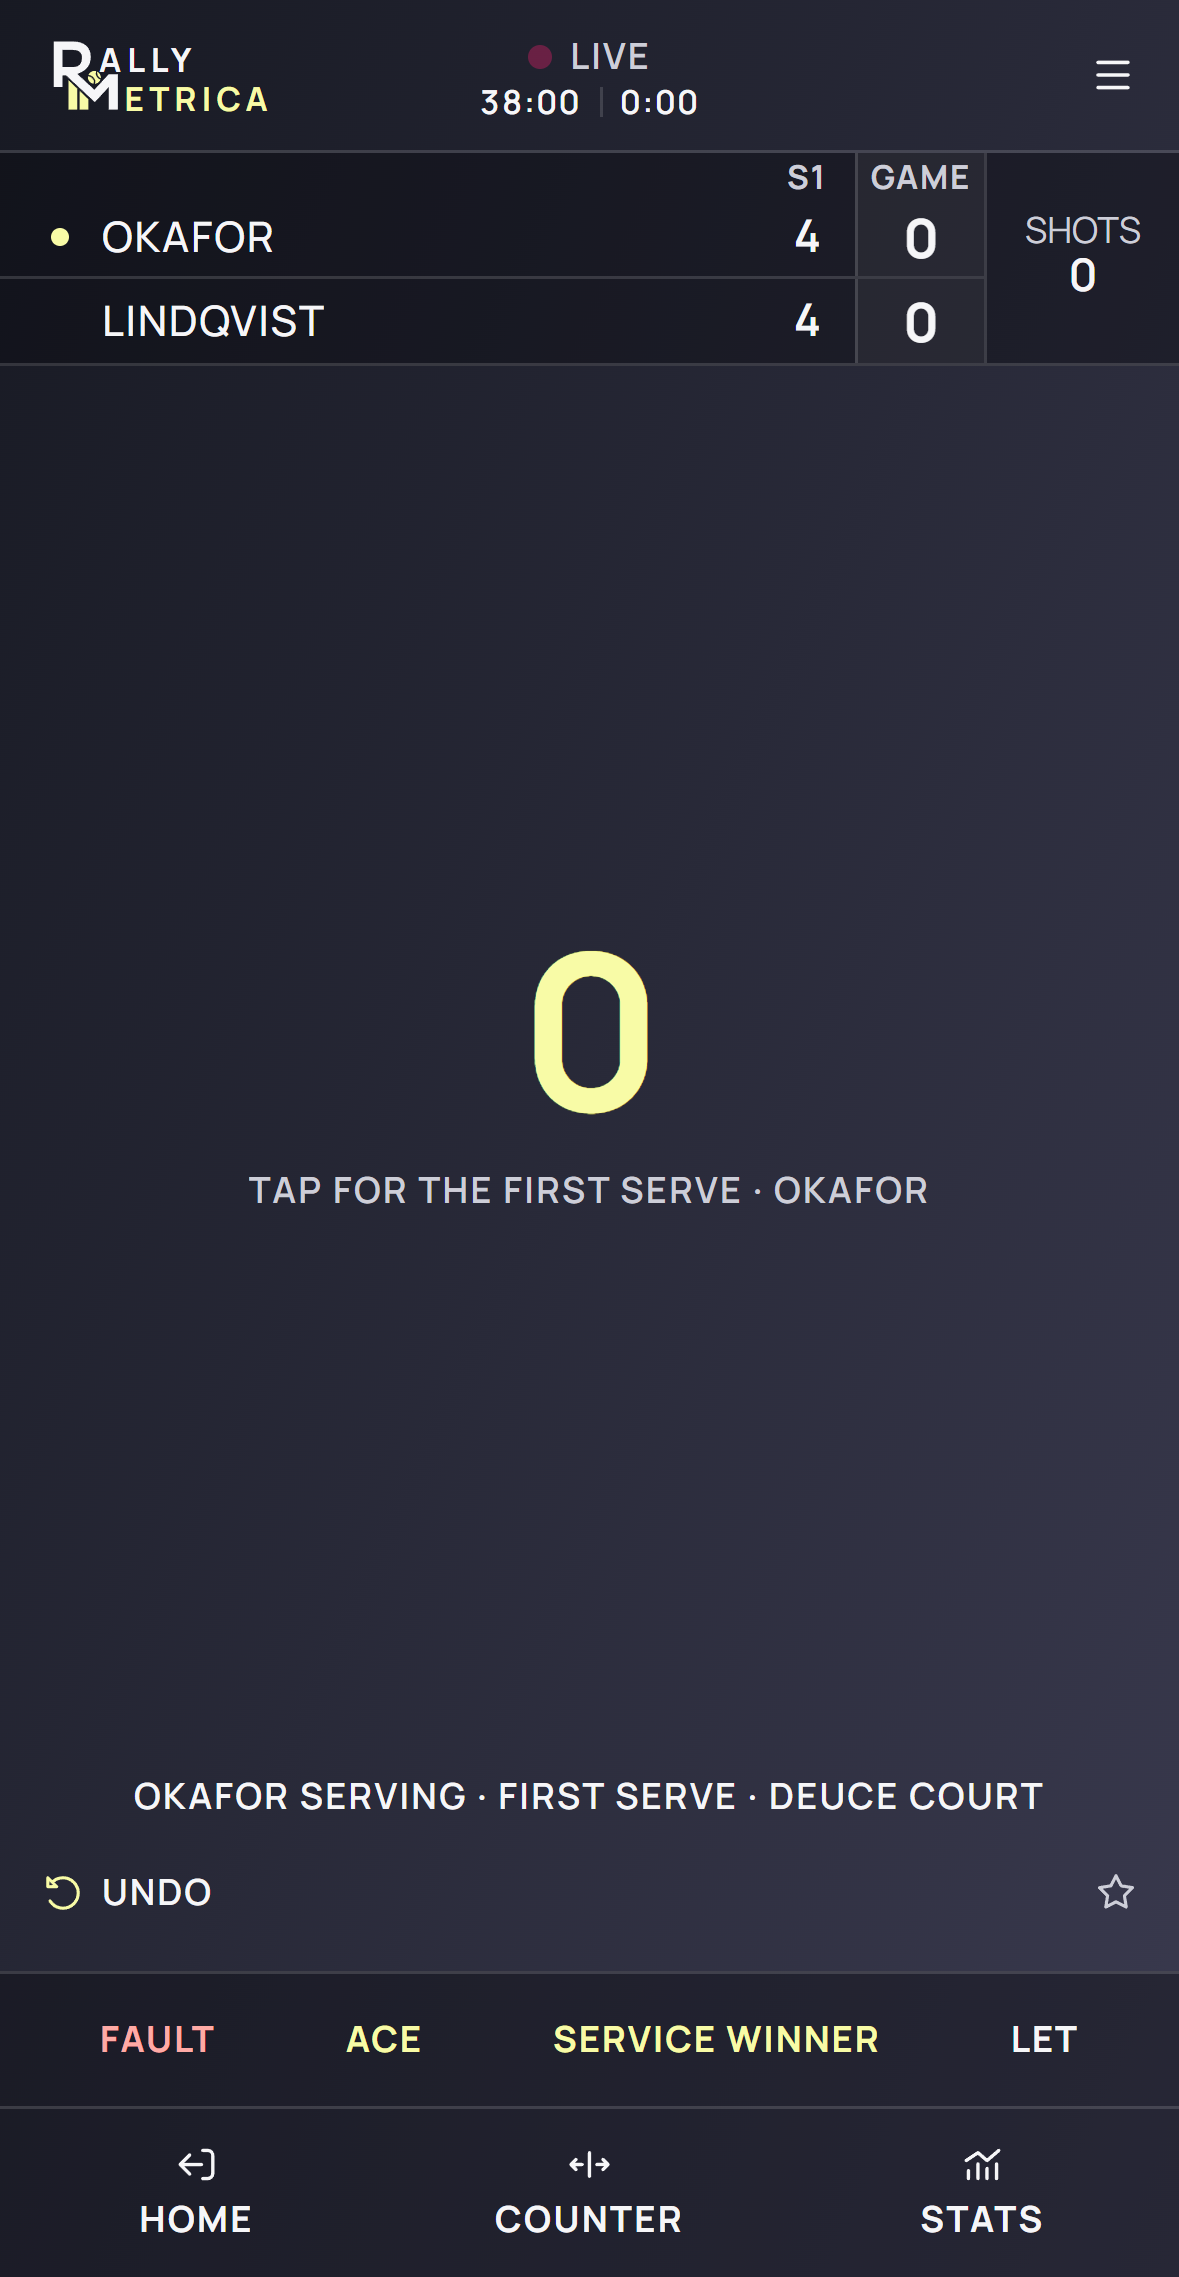
Counter
You tap once per shot and record how the point ended — ace, service winner, winner, forced or unforced error, double fault — and the wing. Everything about serving, returning and endings follows.
Unlocks · Serve · Return · winners and errors · rally length · Aggression
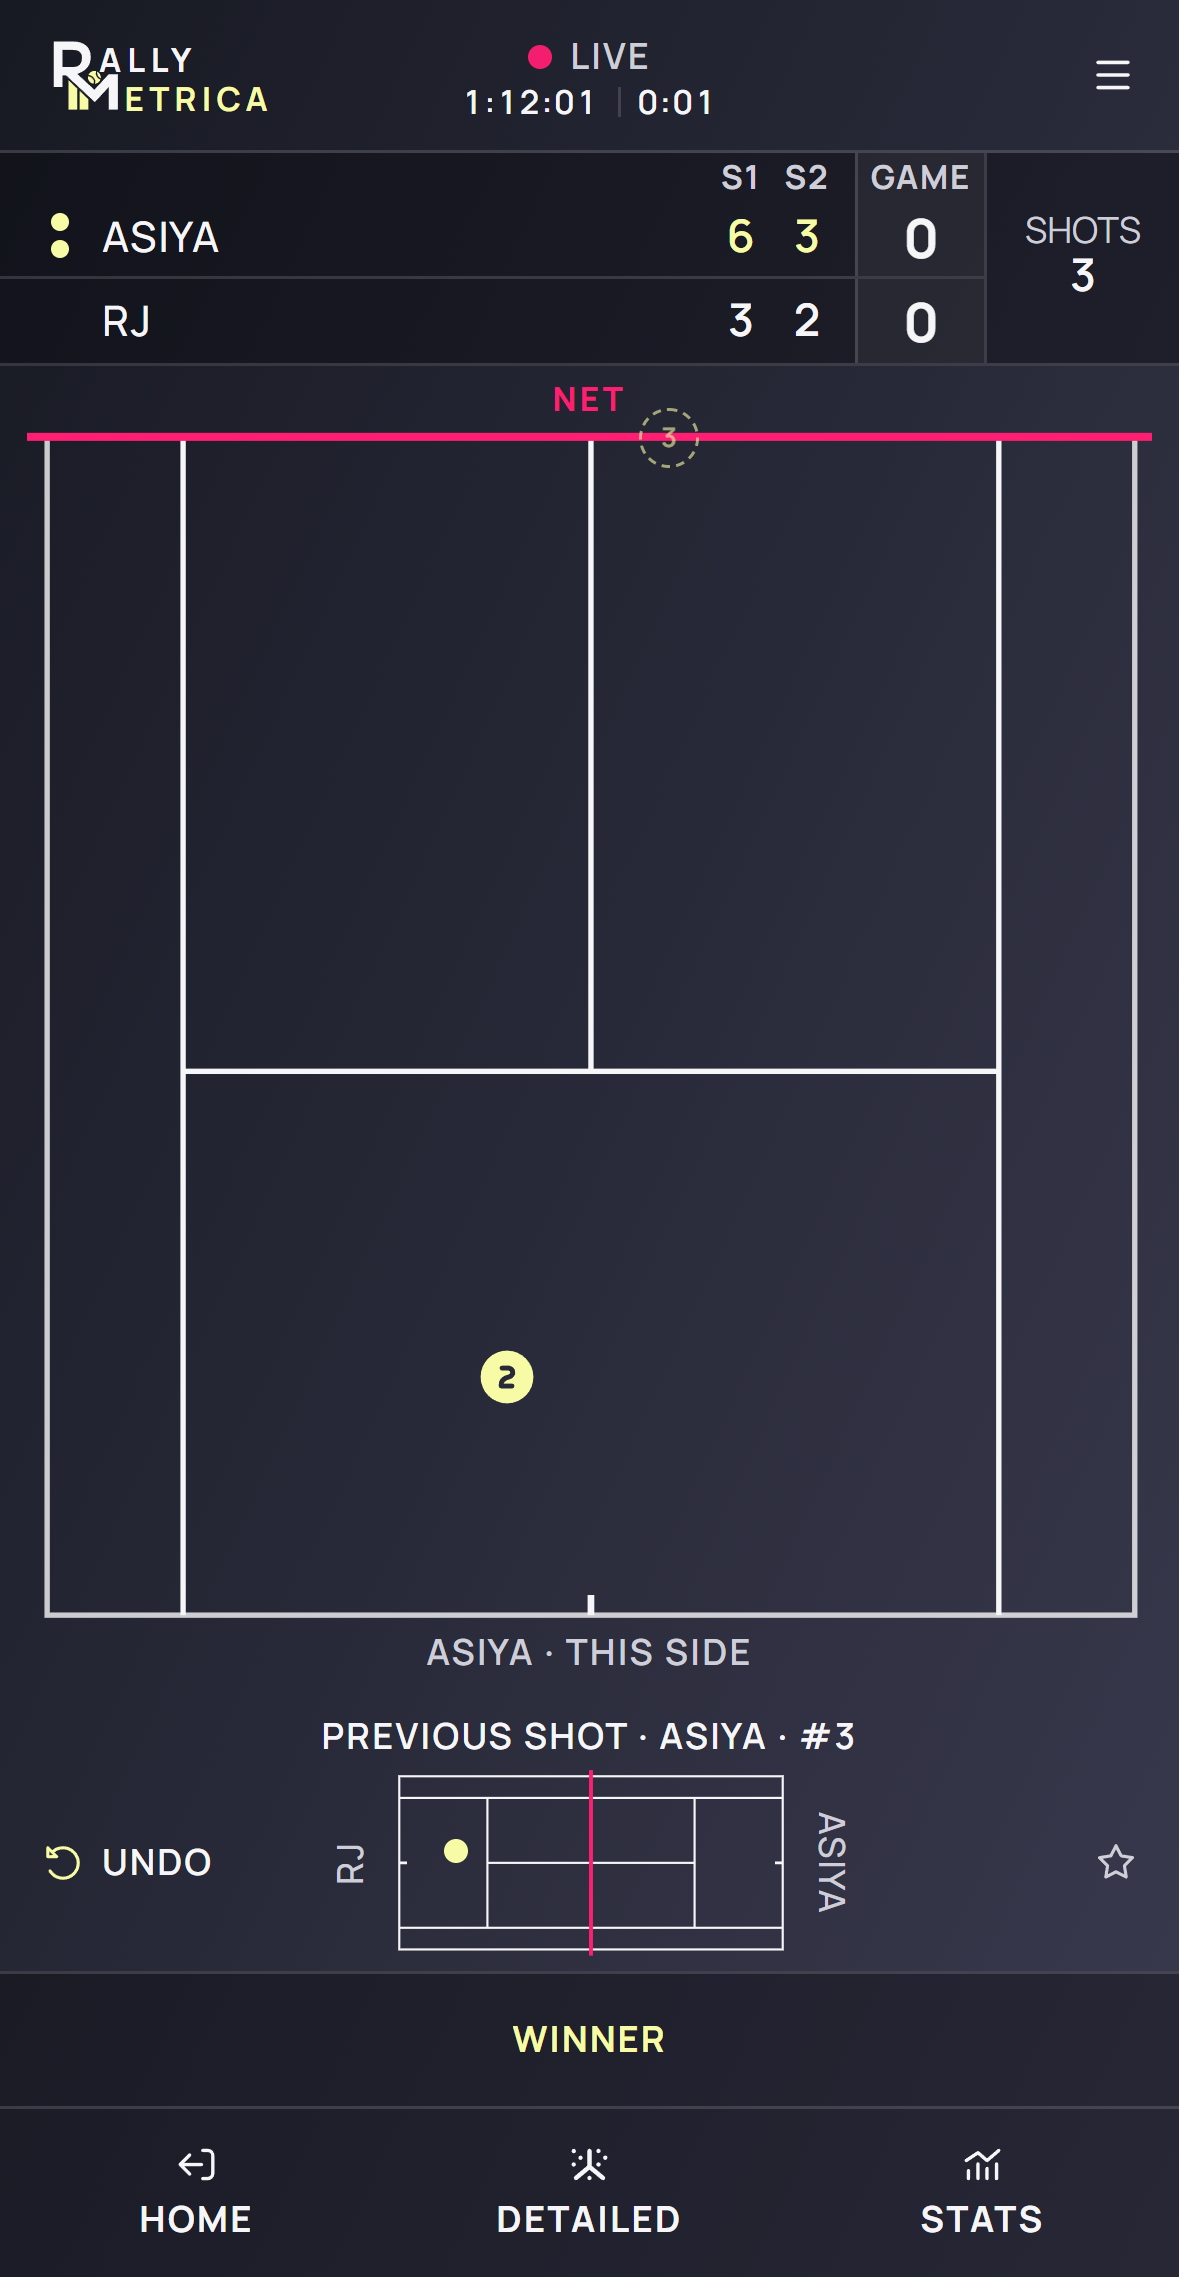
Detailed
You tap where each ball landed. That adds the geometry: direction and depth, serve targets, zone traits, the landing maps, the full rally replay and pattern matching.
Unlocks · Placement · Landings · serve zones · Patterns · replay paths
The catalogue
One catalogue feeds the report’s tables, the player profile’s trends and the Stats tab’s chart, so a row means the same thing everywhere. Each row knows which direction is better; a report table lights the better side. Ratios show the fraction beneath the percentage.
Points
Report page · POINTSThe headline rows: the result, the serve, and how points ended.
Return
Report page · RETURNThe same facts read from the receiver’s side.
Pressure
Report page · PRESSURETwelve rows, every one read from the score before the point. Only Score tracking is needed for all of them.
- A set point or match point is decided before the point is played: winning it would end the set or the match, for either side, under the match’s rules. The engine replays the scoring rules to know.
- Game-level rows (breaks consolidated, breaks back) read whole games, so a set filter applies to them and a score filter does not.
Placement
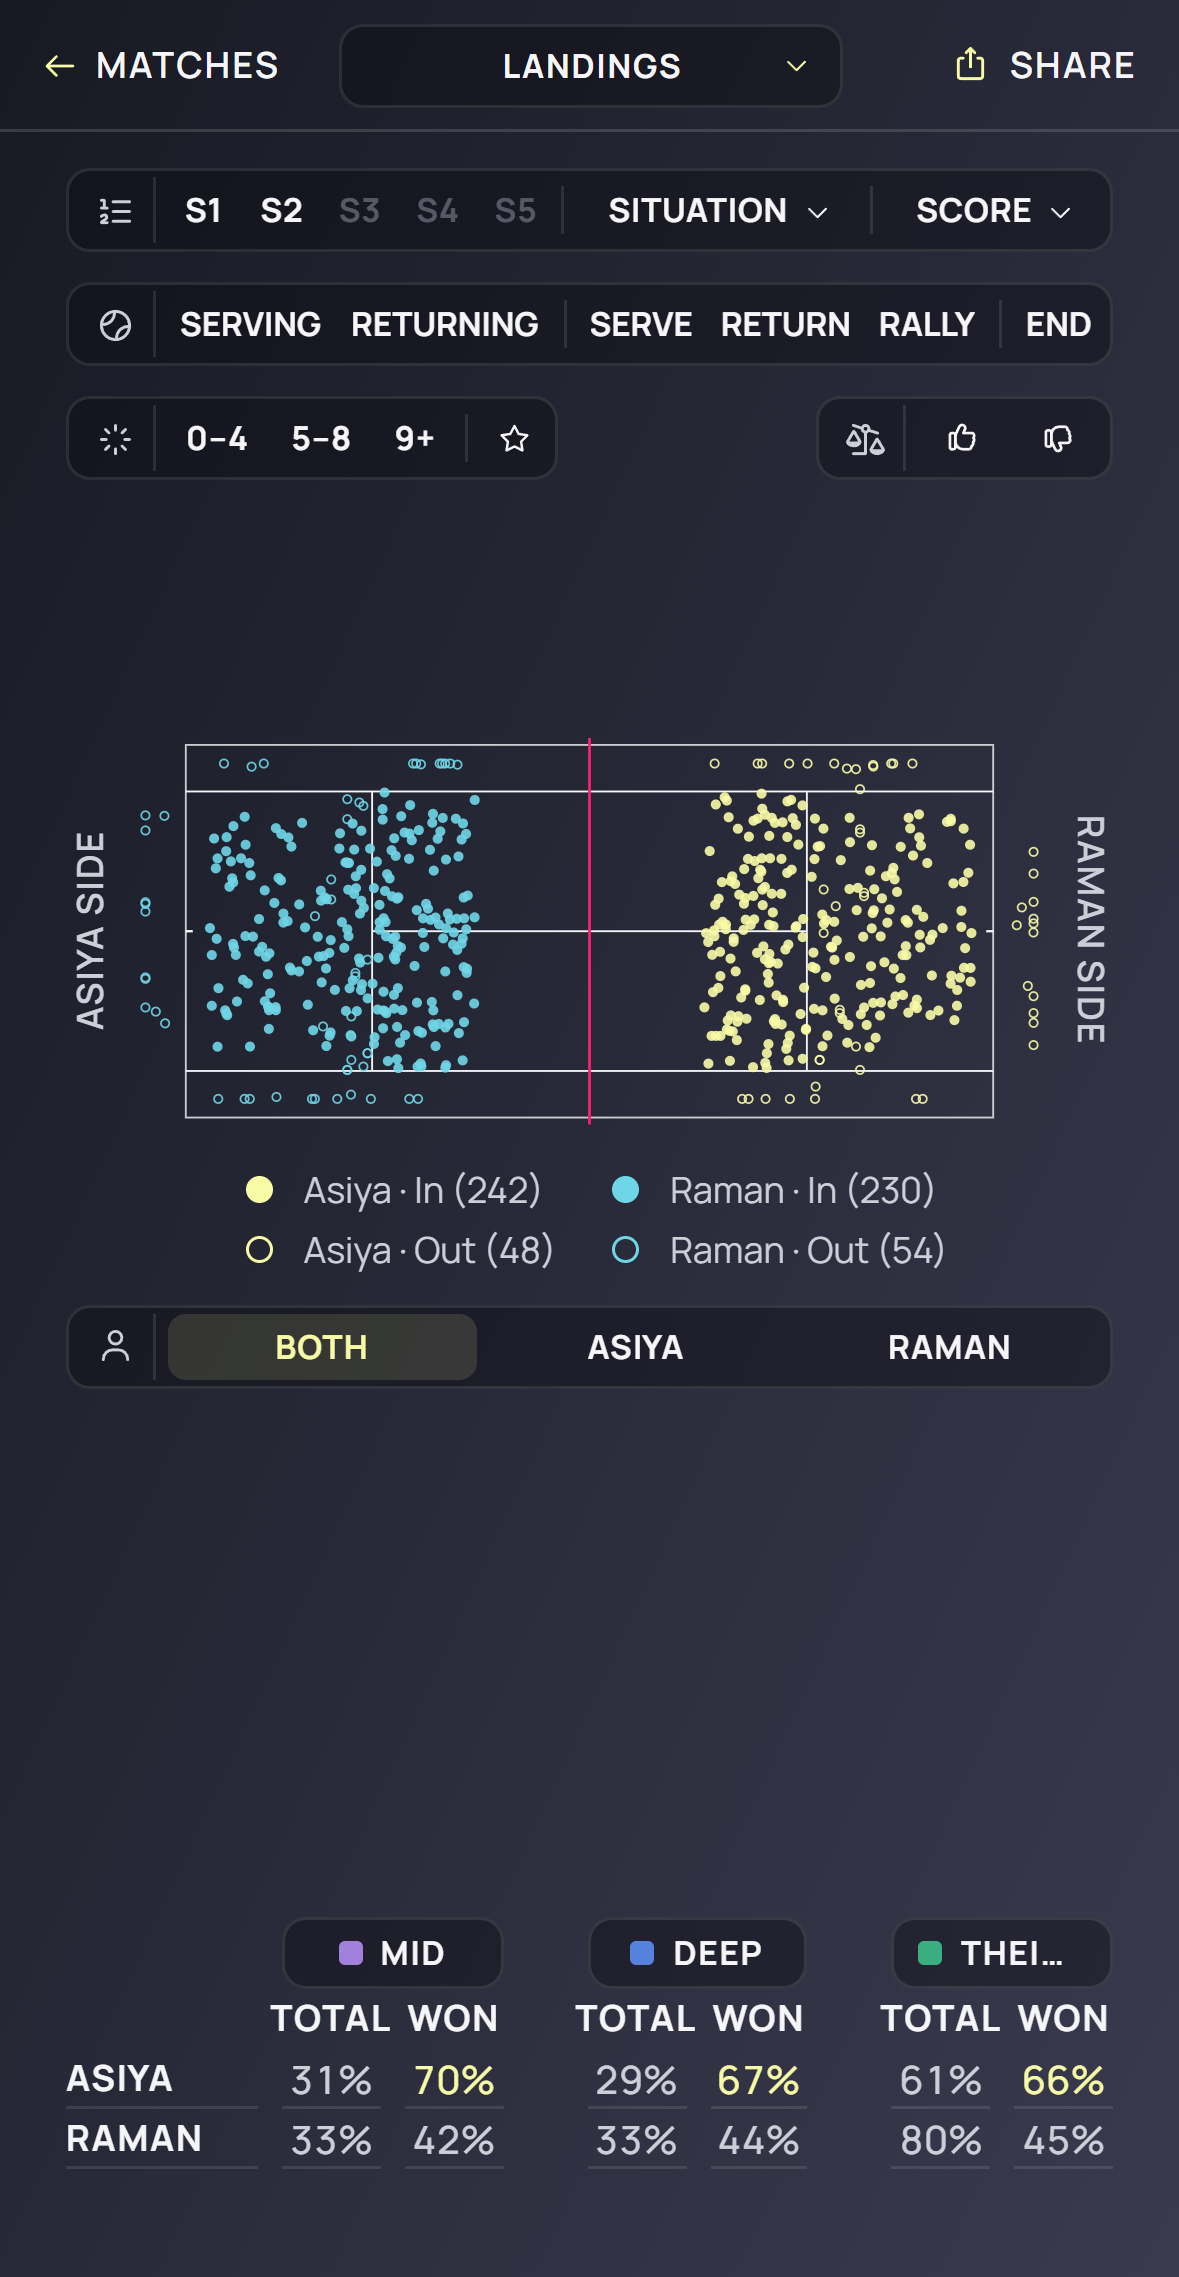
Report page · PLACEMENT · LANDINGSWhere the balls went. Every row here needs the landings a Detailed match records.
- Where “deep”, “middle” and the forehand zone begin is set per player — the zone traits under Players → profile → Zones (Middle 10–75, Deep 50–90, FH 50–100, T · wide 5–25). A change made at match setup applies to that match only.
- A serve has no origin, so serve placement reads T · middle · wide only: no direction or depth rows, and no forehand-zone row — which wing a serve found depends on the service box and is never inferred from geometry.
- Shot speeds and stroke counts (forehands, backhands, volleys, overheads) appear on a SHOTS page only for matches that recorded them.
Aggression
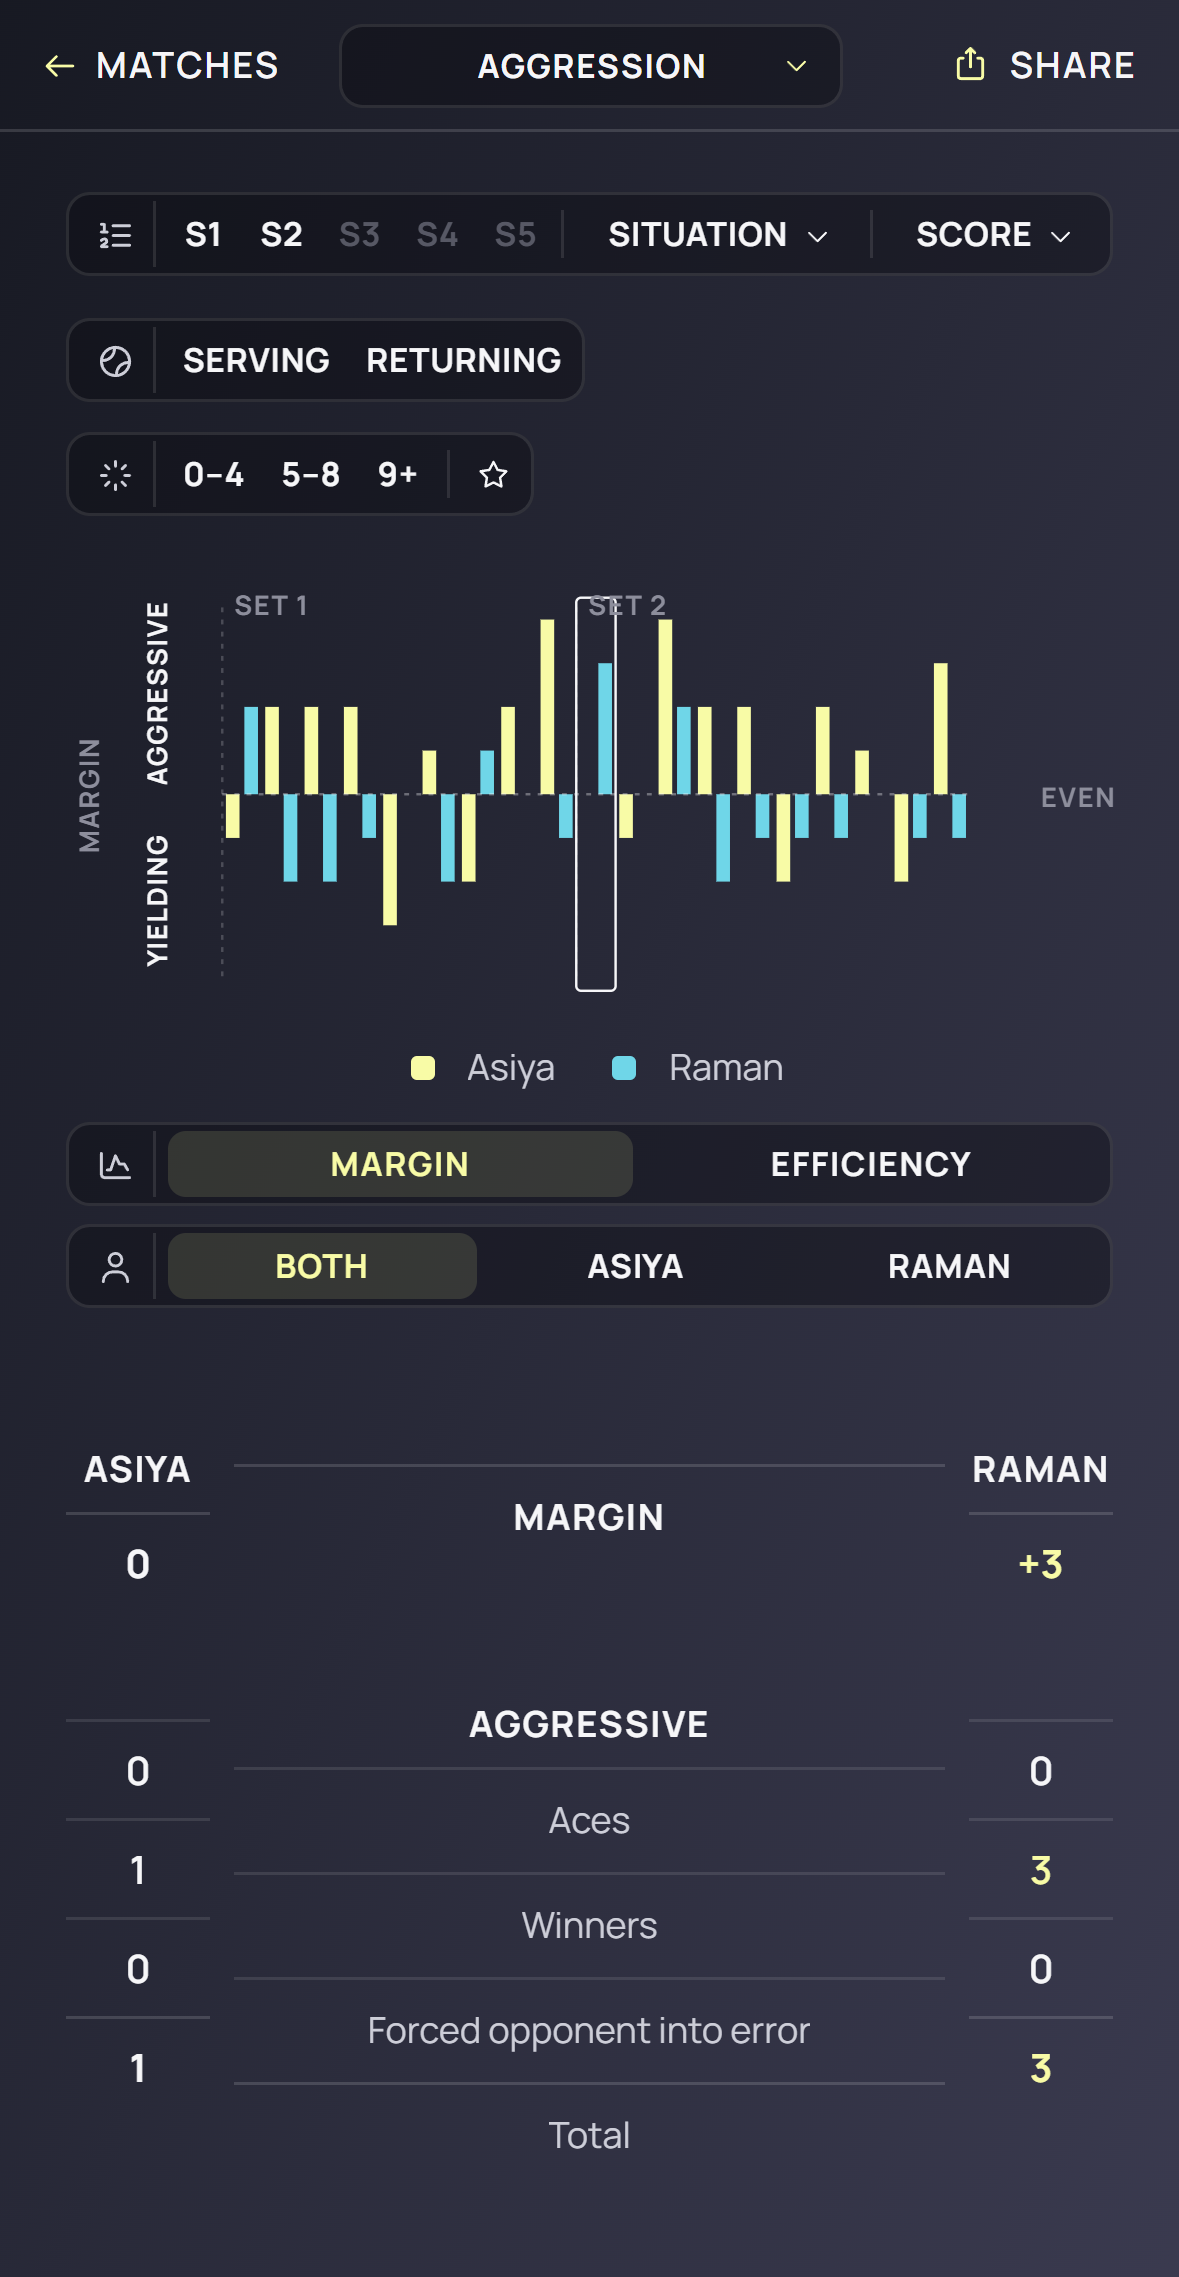
Report page · AGGRESSIONWhether a player is building points or giving them away — the classical aggressive margin, written out for how Rallymetrica tags a point.
The aggressive margin is Bill Jacobsen’s statistic, from the CompuTennis charting of the 1980s. It starts from a fact about the sport: a point can only end three ways — a winner, a forced error, an unforced error — so from the winner’s side every point is a winner struck, an error forced from the opponent, or an error the opponent handed over. Jacobsen put the first two together as the points a player made happen and set the third against them. The margin is the net: points built minus points given away.
Craig O’Shannessy (Brain Game Tennis; strategy analyst to the ATP Tour and, for three seasons, to Novak Djokovic’s team) is the reason the margin matters more than the winners-to-unforced-errors ratio broadcasts quote. In his charting of the professional game, forced errors were 42% of all points, unforced errors 28% and winners 30%: seven points in ten end in an error, and the forced error — the category the ratio leaves out — is the single most common way a point ends. A statistic blind to forced errors is blind to the main thing a player is trying to do, which is make the opponent miss.
Because every point is one of the three, the two players’ classical margins differ by exactly the point score: margin A − margin B = points A − points B. The margin is each player’s share of the scoreline, split into what was built and what was given — which is why the match winner all but always owns the higher margin, and why the rare exceptions are matches won on fewer points. The same margin can be reached two ways: 20 winners against 20 unforced errors and 5 against 5 are both zero, but the first player decided forty points and the second ten. Efficiency (built ÷ given) gives the exchange rate; built + given — the decided points — says how much of the match ran through that player’s racket.
The classical count charges a forced error to nobody but the attacker, so a player who feeds short balls all afternoon and is punished for it shows a clean sheet. Rallymetrica reads the landing before the error. A forced error that follows your own short, middle ball — not past the service line, in the middle third of the court — is invited: still the attacker’s point built, but also a point you gave. Every other forced error is pressured and stays the attacker’s alone. The cost is deliberate: charging invited errors to both sides means the two margins no longer differ by exactly the scoreline; the scoreline is on the cover, the margin is about responsibility. Tracked at Counter level there are no landings, every forced error reads as pressured, and the margin is Jacobsen’s to the point.
built = winners + aces + forced errors drawn
given = unforced errors + double faults + invited forced errors
margin = built − given
efficiency = built ÷ given
classical count (no landings): margin A − margin B = points A − points B
The two rows
- The invited / pressured split needs landings. A forced error you commit is invited when your own previous ball landed short and middle — not past the service line, and in the middle third of the court’s width. It counts −1 against you and +1 for the attacker. Every other forced error is pressured: the opponent beat a player who was in the point. It is shown in grey and not counted.
- On a Counter match there are no landings, so every forced error reads as pressured — the opponent’s credit. The page says so: tracked without landings, forced errors read as the opponent’s.
- The report page draws MARGIN or EFFICIENCY as a running line through the match — AGGRESSIVE above the EVEN line, YIELDING below, set by set — for both players or one. Beneath it, the headline per player and the counts the line is made of: AGGRESSIVE (aces, winners, forced opponent into error) and YIELDING (unforced errors, double faults, invited forced errors), so the court calls the margin rests on stay visible. Both rows read a dash under ten decided points.
Momentum
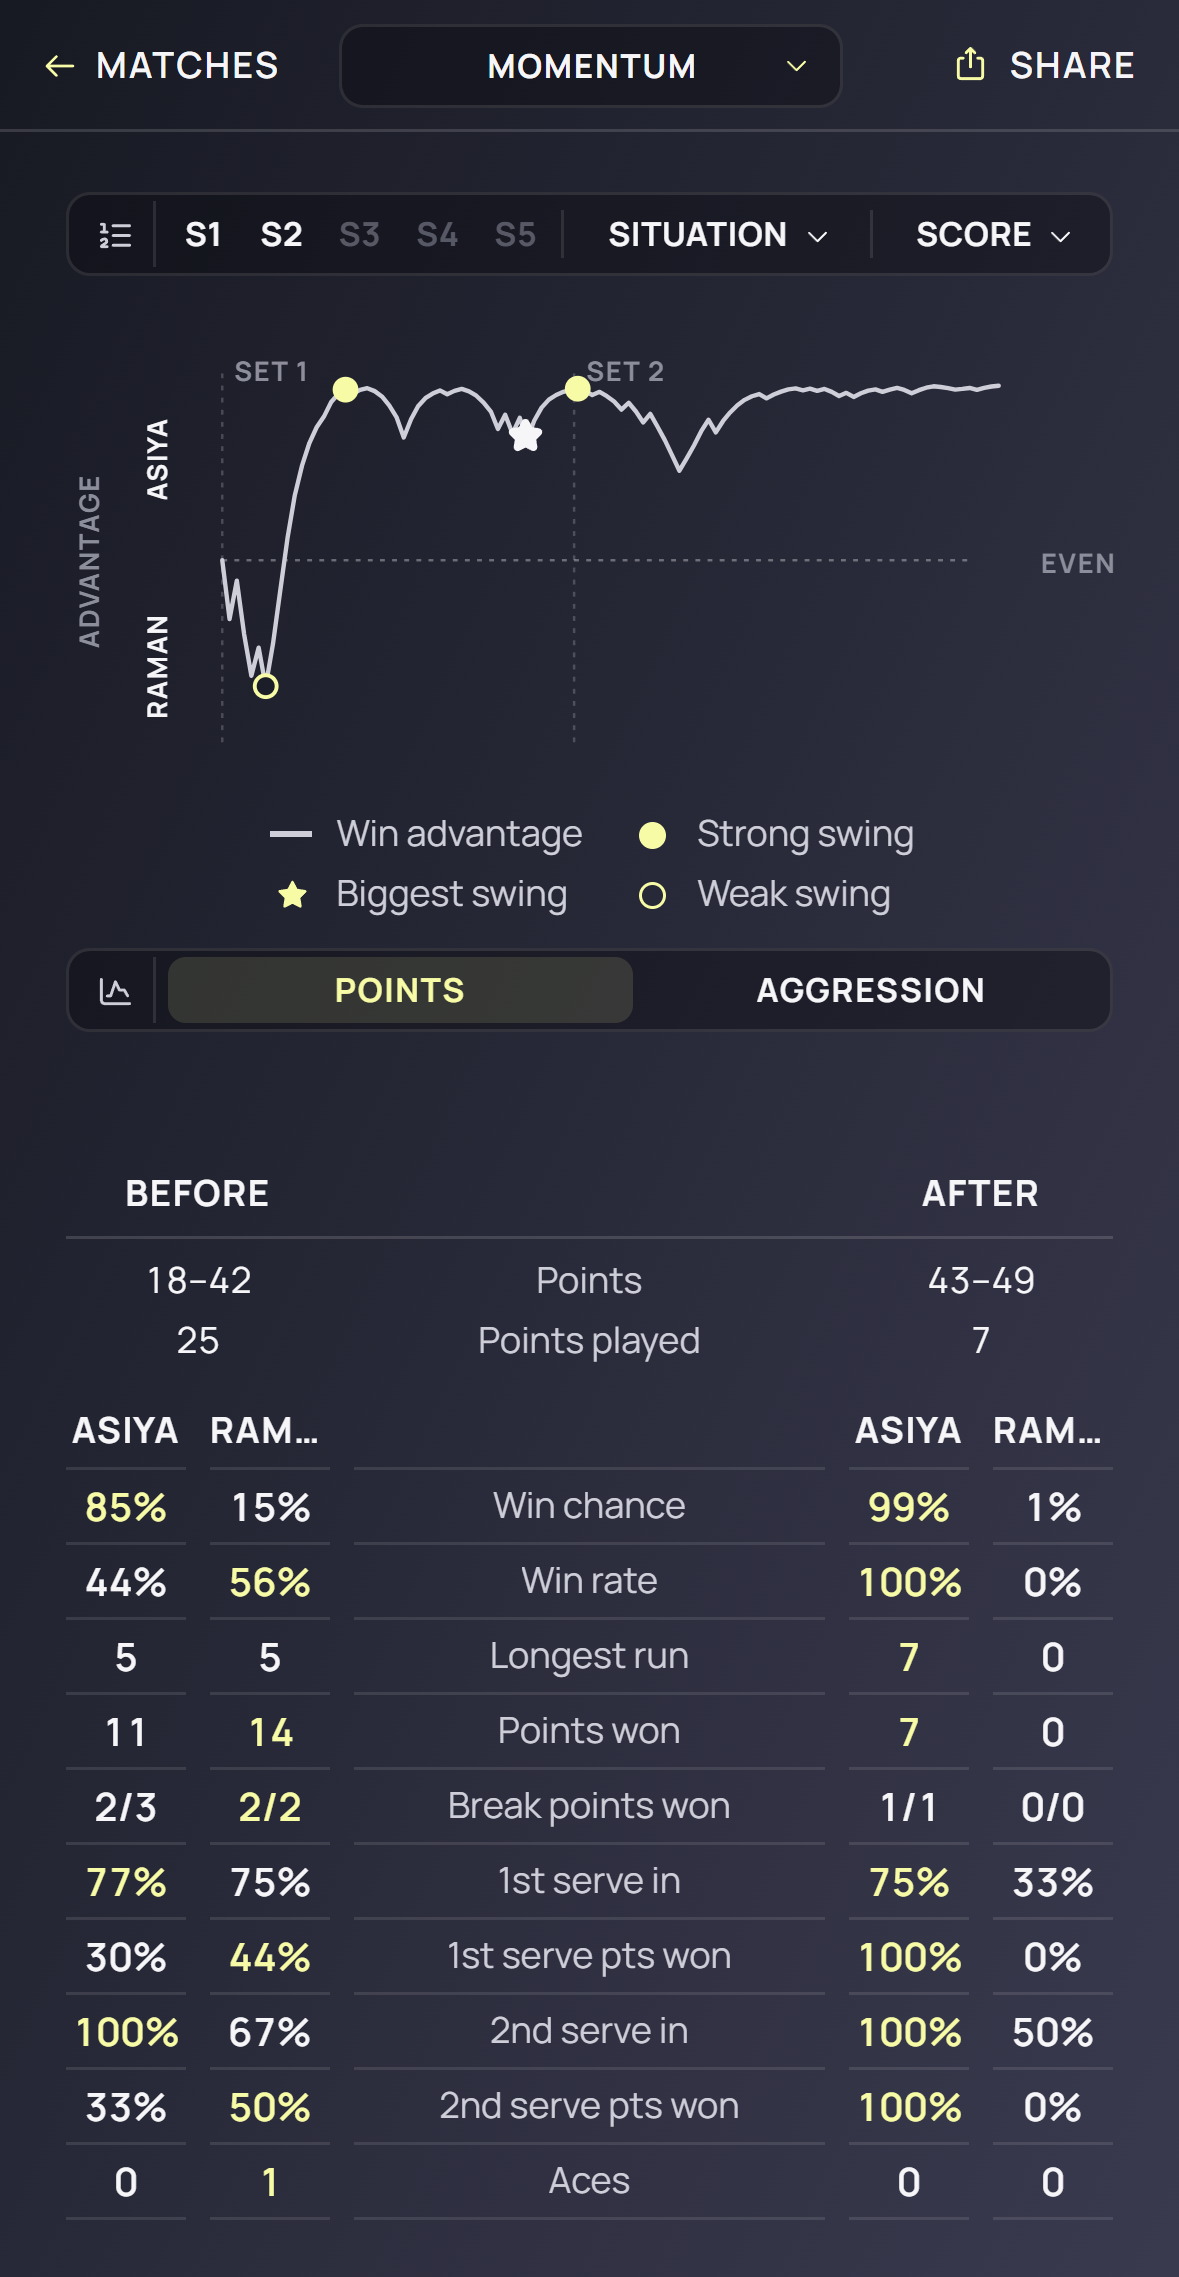
The momentum curve is the probability that a player goes on to win the match, recomputed after every point from the exact score and the rules in force — set format, tiebreak, no-ad. The serve-point rates behind it start from the player’s history and update as the match goes on, so the curve settles the longer the match runs. Only Score tracking is needed.
Swings are the moments the curve changed course most. The engine finds the change points, weighs each by how much was riding on it, and marks the strong ones with a disc, the weak ones with a ring and the biggest with a star. Tap a swing to compare the stretch before it with the stretch after: points played and win chance for each player.
Live, the curve extends as points arrive. Under a cut, momentum highlights rather than filters: a set cut fades the other sets, a score or situation cut beads the curve at those points — blue where the first player won them, green the second.
Two currencies: POINTS · AGGRESSION
The page draws momentum in two currencies, switched under the legend. POINTS is the win-advantage curve described below, with its swings and the swing table; it needs only the score. AGGRESSION is a form line and needs a Counter match: each point scores +1 if the player built it (a winner, an ace, a forced error drawn) and −1 if they gave it (an unforced error, a double fault, an invited forced error), and the line is an exponentially weighted average of those scores over roughly the last twelve points — the most recent count most, so the line remembers the last few games and forgets the first set. With BOTH players shown it is one player’s form minus the other’s: above EVEN, the player named at the top has been the more efficient lately. With one player picked it is that player alone: above EVEN they have been building more than giving. The AGGRESSION report page’s own line is the running built ÷ given for the whole match so far, so it settles; the momentum form line is meant to move. No swings or table on that view.
The model behind the POINTS curve
Tennis has had a working probability model since the early 1970s, because the game is a ladder of small contests — point, game, set, match — and once you know how often each player wins a point on their own serve, every rung follows by the same arithmetic. Hsi and Burych (1971) and Carter and Crews (1974) worked out the game and the set; Klaassen and Magnus (2003) turned the ladder into a forecast updated point by point, which is what this curve is.
Call p the chance the first player wins a point on serve and q the second player’s. From deuce a server holds with p² ÷ (p² + (1 − p)²): at p = 0.6 that is 69%, from the start of the game 74%, and 71% under no-ad, where one point decides deuce. Ten points in a hundred above even on the point become twenty-four above even on the game; the ladder amplifies. The same recursion climbs: hold-or-break probabilities give the set under its format — advantage sets, a tiebreak at 6–6 with its own serve rotation, no-ad with one point deciding deuce — and sets give the match. The curve’s value after a point is the match probability from the exact score reached.
Nobody knows p and q before the match. The engine starts each from the player’s history, counted as if it were κ serve points of evidence, and adds the match’s own serve points one by one: p̂ = (κ·p₀ + serve points won) ÷ (κ + serve points played), and q̂ the same from the other player’s serve. The match’s weight is N ÷ (κ + N), so history matters most in the first games and fades as serve points accumulate. The estimates steady as the match goes on; the curve itself does not — late points in a close match carry more, so it can swing hardest at the end.
How far a point can move the curve is its importance, in Morris’s sense (1977): the win probability if the point is won minus the win probability if it is lost, both read with the rates as they stood before the point. At p = q = 0.6 in a best-of-three, 30–0 in the first game is worth about two points of match probability; a break point at 5–5 in a deciding set can swing a third of the match. The curve moves by importance times surprise — one minus the chance of winning the point if it was won, minus the chance if it was lost — so winning a point you were favoured to win moves it less than losing it would have: at that 30–0, about +0.7 up or −1.1 down. The swing finder reads the curve for its turning points — where a run of one player’s points gives way to a run of the other’s — ranks them by how far the curve moved, ignores zigzags too small or too close together, and stars the largest. In a live match the newest turn is provisional until the next points confirm it. A short turn built of break points outranks a long one built of 30–0s because the curve moved further, not because anyone weighted it.
Momentum here is the broadcast sense — where the match stands and how it got there — not a claim that winning a point changes the next one. The evidence on that is modest. Klaassen and Magnus (2001), on professional matches at Wimbledon, found that points are not quite independent: winning the previous point raises the chance of winning the next by a little, and servers win fewer of the important points than of the ordinary ones. Both effects are small, and a model that ignores them forecasts almost as well. So the curve treats each point on its merits, and the swings show where the run happened without saying why.
P(hold from deuce) = p² ÷ (p² + (1 − p)²)
P(hold) = p⁴ · [1 + 4(1 − p) + 10(1 − p)²] + 20 p³(1 − p)³ · P(hold from deuce)
p̂ₙ = (κ·p₀ + serve points won) ÷ (κ + serve points played) · match weight = N ÷ (κ + N)
importance Iₙ = P(win | point won) − P(win | point lost), rates as before the point
move after point n = (won − chance of winning it) × Iₙ, plus the small step from updating p̂ and q̂
curve after point n = P(win match | exact score, p̂ₙ, q̂ₙ)
aggression form = exponentially weighted mean of (+1 built, −1 given), ≈ last 12 points · BOTH = form A − form B
Reading it
- The starred swing is the largest the curve made. Tap it and compare the two stretches: if your win chance fell while your share of points barely moved, you lost the big points, not the rallies — go to PRESSURE.
- A swing made of break points at 4–4 outranks a longer run at 1–0 because the curve moved further. Judge the match by the swings, not by how long each run lasted.
- On AGGRESSION, a form line under EVEN while the POINTS curve still rises means the points are coming from the opponent’s gifts, not from you building them — a lead that is not yours to keep.
- Under a set cut the other sets fade rather than vanish, so a swing can be read against the whole match.
Patterns
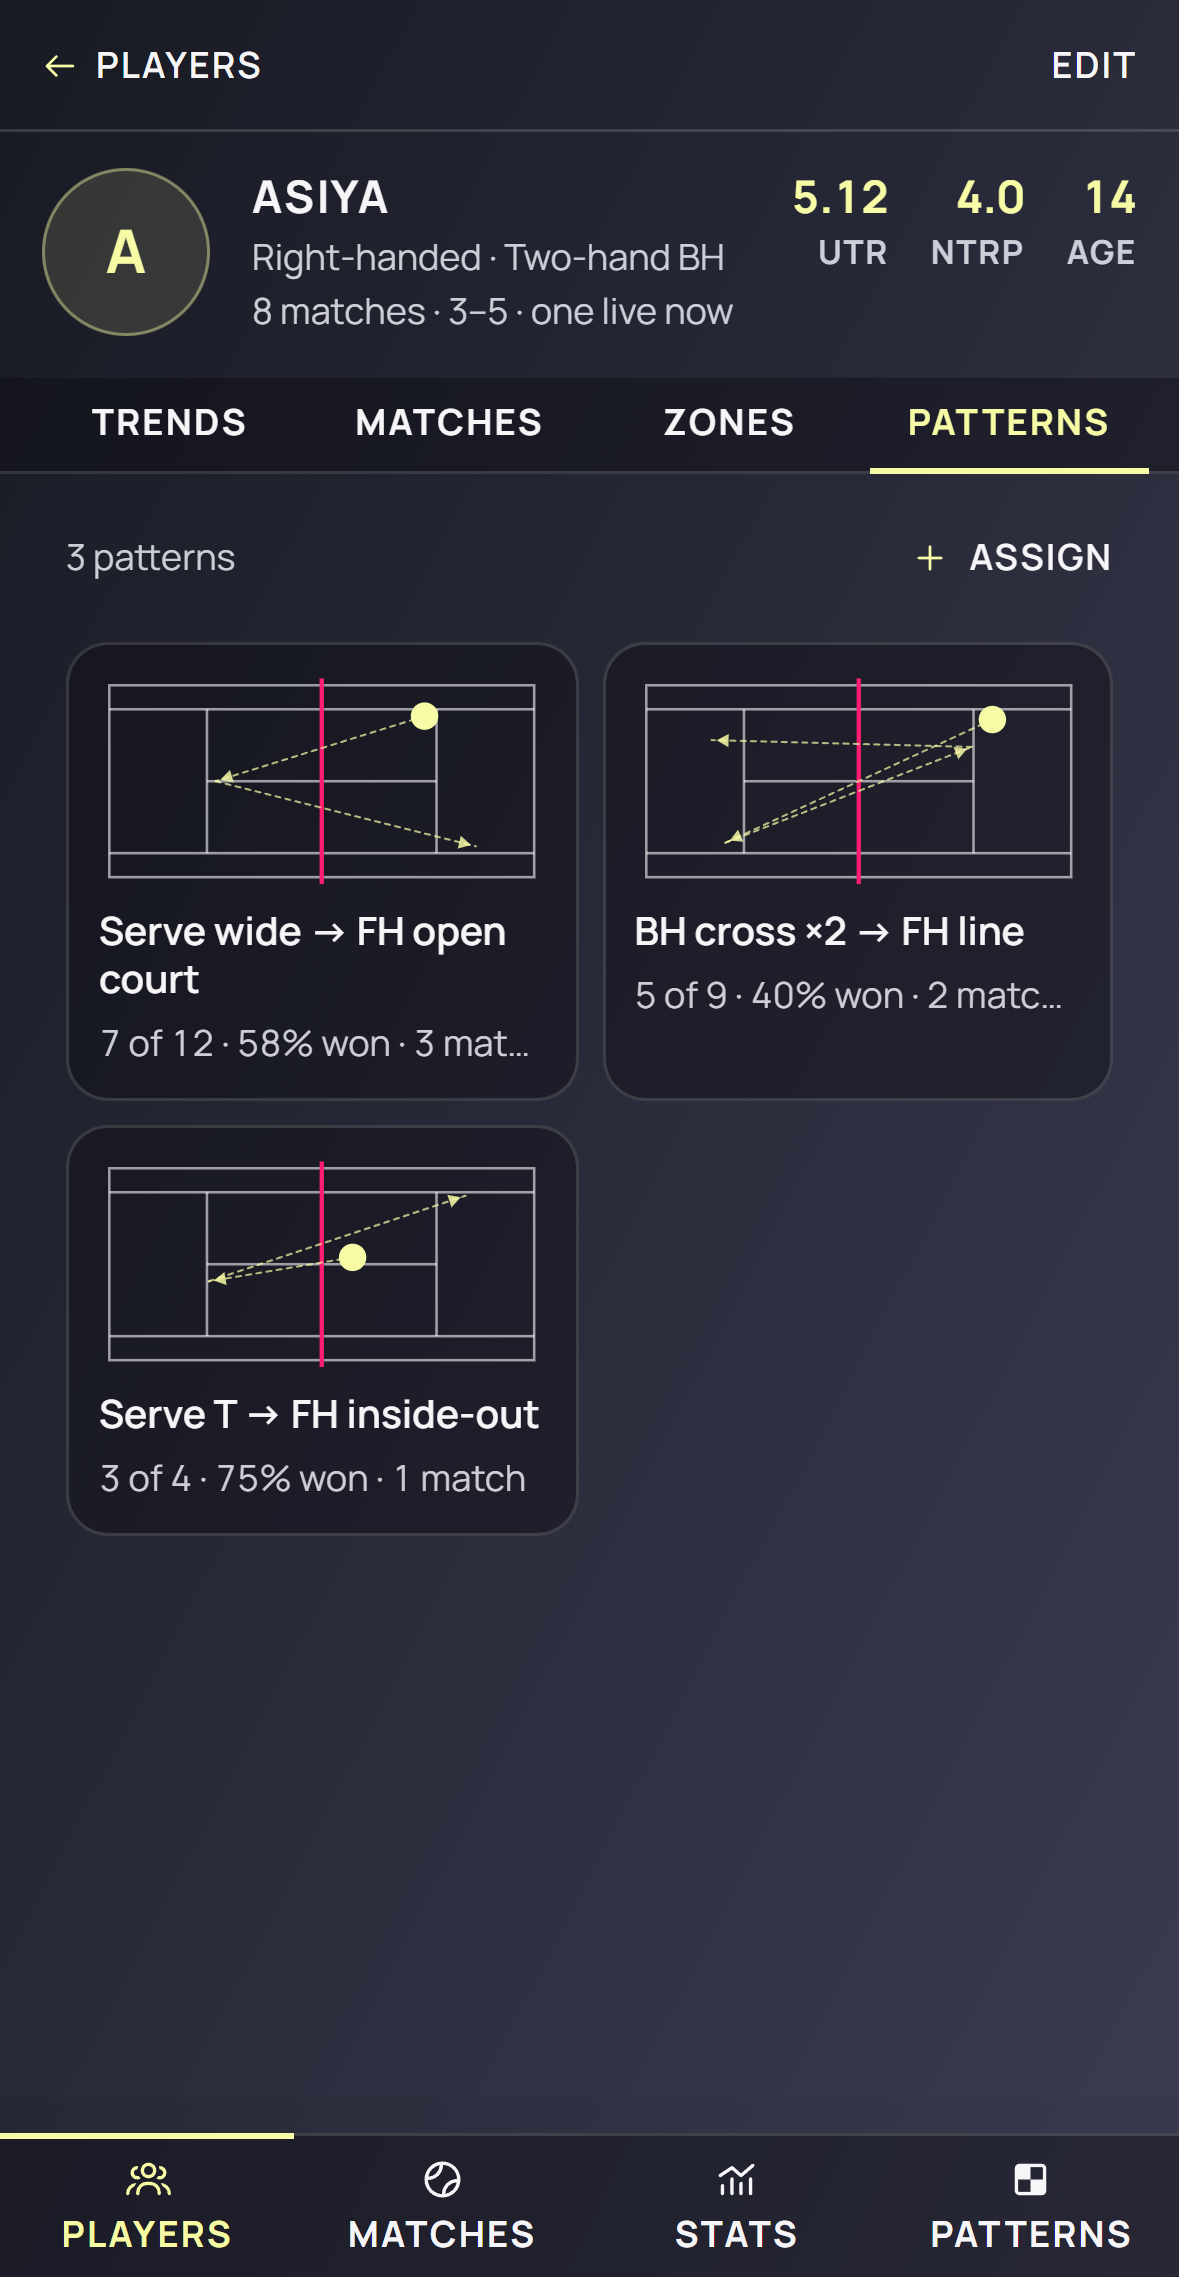
A pattern of play is a sequence of two to four landing zones drawn by a coach and assigned to a player. Up to three patterns are selected per player in a Detailed match setup; the engine then matches every recorded point against them.
An attempt is counted when a point reaches the pattern’s opening zone with the right player hitting and the right serve context (any, first or second serve, when the pattern opens with a serve). A completion means the full sequence of zones was recorded, in order; consecutive landings must alternate sides. Each pattern counts at most once per point.
3 of 7 attempts · 67% won reads: three complete executions from seven openings, and two of those three points won. The percentage is points won after completion, which is the question a coach is asking. A match keeps the patterns selected at its start; later edits do not rewrite its results. Player profiles bring the results together across Detailed matches.
Cuts: asking a narrower question
Every table page, TIMELINE, MOMENTUM and LANDINGS carry the same filter track; so does the Stats tab. A cut keeps only the points that fit, and every row is recomputed from them.
- Set — S1 … S5, the sets the match played.
- Situation — one at a time: Break point (the receiver is a point from breaking); Break game (every point of a game the receiver won); Break consolidation (every point of the service game straight after a break, held or not (same set, no tiebreak)); Tiebreak (every tiebreak point); Set point (before the point, winning it would end the set, for either side); Match point (before the point, winning it would end the match, for either side).
- Score — the game score before the point, read server first: the presets First point · 30–30 · Deuce · Advantage, or any pair on the two wheels. A score cut rests under a point situation and stays live inside a game situation — “30–30 points inside break games”.
- The page’s own tracks — Serving · Returning; rally length 0–4 · 5–8 · 9+ (a point property, so under a serve view 9+ reads “where the serves landed in points that became long rallies”); starred points; on the serve and return pages Deuce · Ad and T · Mid · Wide; on the landing maps Serve · Return · Rally · End.
An option greys out when no row on the page can use it, or when it could not change the row — rally length on aces, break point on break points. PRESSURE turns the score cut off because each row names its own score; COVER and PATTERNS take no cuts; Win rate takes none.
Stats over time
The Stats tab charts one catalogue row across a window of matches, so a number you saw on one report becomes a question about you: is this where I usually land, and which way is it moving? On Free and Player the subject is you; on Coach, any player on the roster. Choosing an opponent narrows the window to that head-to-head; on Coach, picking two players and a common opponent draws both as series on one axis.
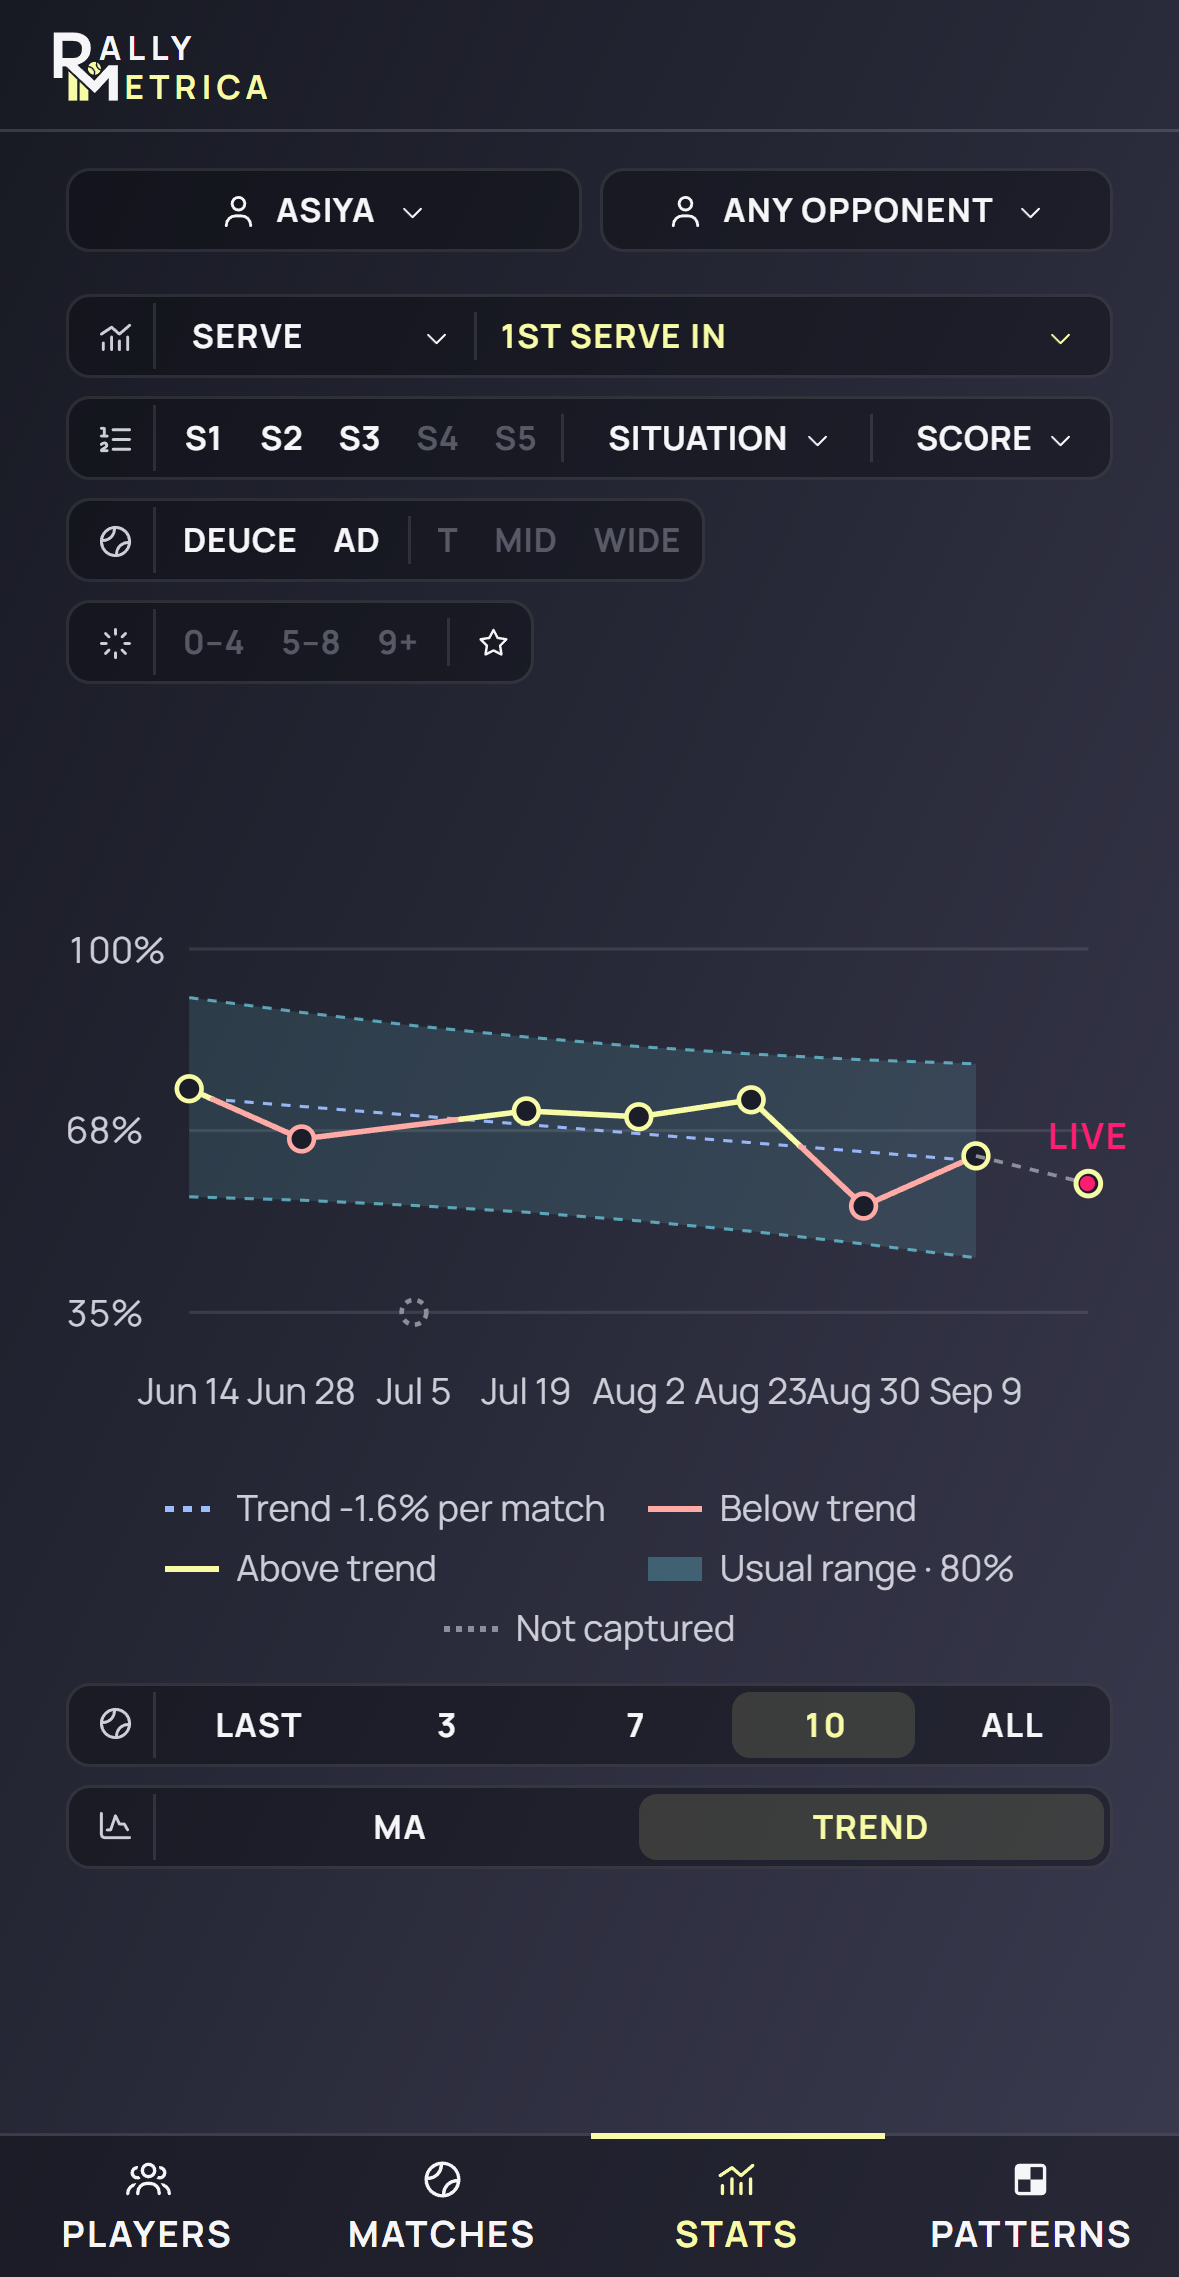
The window is Last · 3 · 7 · 10 · All, shared with the profile’s Trends. Each match’s value is computed from that match’s own points under the same cuts — the chart is the report, repeated. A dotted gap is a match that did not capture the row (a Score match has no first-serve percentage); it is never a zero.
Two views, two questions
MA answers where is my normal? It draws the window mean as a flat line. TREND answers which way is it moving? It fits a straight line through the matches by least squares and states the slope in the legend: −1.6% per match means the row has drifted down about a point and a half each match — roughly fourteen points across a ten-match window. The moving average needs two matches, the trend three.
The usual range
The blue band is the usual range: the middle 80% of where a normal match for this player lands. It is a prediction band, not a confidence band. The question is not “how well do we know the average?” but “was today a normal day for me?”, which is about the next match — so the band carries the scatter of a single match: half-width t · s · √(1 + 1/n), with s the spread of the window’s matches and t the 80% value for that many matches. Around the trend the same band follows the line and is slightly wider at the ends, where the line is least certain. It needs five matches; before that there is no honest range to draw.
Why 80% and not 95%? At seven matches a 95% band is ±19 points — wider than the chart, so every match is “normal” and the band says nothing. At 80%, one match in five falls outside by construction: outside means a top-tenth or bottom-tenth day for this player. Inside is a normal day, outside is notable — that is the whole reading.
The colours
The line is yellow where a match sits above the average or the trend and red where it sits below. Colour is relative to the player’s own line, never to a good or bad number: a 55% that beats a 50% average is yellow. A match in progress is the last, hollow point with the pink pulse and LIVE above it, joined by a dashed lead; it is drawn but left out of the mean, the trend and the band until it finishes. Tap any dot for that match’s card and its report.
Reading it
- One red dot inside the band is a normal bad day. Change nothing.
- A dot outside the band is notable: open the report and find out why — the opponent, the surface, a cut that explains it.
- Three matches in a row on the same side of the average, even inside the band, say the level has moved; the trend’s slope says how fast.
- A flat trend with a wide band says the problem is consistency, not level. A steady slope with a narrow band is a real change, in either direction.
- Put the cut on before you judge: 2nd serve points won under Break point, across ten matches, is the honest test of the second serve you have been practising.
Reading a missing value
- A dash means the value was not captured at this match’s tracking level, or that no points fall under the current cut. It is never a zero.
- In a trend, a match with no points under the cut is a gap, not a drop.
- The aggression rows read a dash under ten decided points. The moving average needs two matches; the trend three; the bands five.
- Pattern counts come only from recorded landings: Counter and Score matches have no attempts and no completions.
Keep exploring